
The income statement is extremely important to the role of an accountant, and provides excellent insight on the inner workings and performance growth or decline of a business. Through understanding the income statement through and through, we can decipher information such as the specific growth stage a company is in, as well as what the future holds for the company based on metrics such as net income, revenue, and many more. The income statement can really make or break the public image of a company and is extremely vital to the company, consumer, and investor. But on what basis is the income created? We know that it is based on basic accounting standards, but are these standards based on cash accounting or accrual accounting? To understand the difference between the two, we need to know that accrual accounting records transactions as they happen, rather than when the cash flow occurs. For example, accrual accounting would record revenue when a product is sold, rather than when the customer pays. In this case, expenses will be recorded consistently, even if the money has been or will be paid. To reiterate, cash accounting records revenues and expenses at the time of payment. The accrual accounting rules are more common and mandated in the accounting world.
Classifying Expenses
The income statement describes various income sources and expenses that a company faces over the designated period of time the accountant compares. One of the largest expense categories an accountant measures is operating expenses: the expenses associated with production costs, other operation costs, and SGA expenses. Here, operating expenses refer to the cost of any actions the company takes to produce their particular good or service, and SGA refers to the selling, general, and administrative costs – in other words, the costs of performing business. The second major expense category is financing expenses, which deals with non-equity financing (usually takes the form of interest on debt). The third and final major expense category is capital expense: assets that provide benefits over the long-term. An example of this is a manufacturing company that owns several plants or heavy equipment which requires heavy costs to maintain.
But how are these expense categories structured on the income sheet? Firstly, operating expenses are written off as a depreciation over the life of an asset, which translates to capital expense on the balance sheet. Similarly, financial expenses are shown as borrowings (liabilities) on the balance sheet.

Revenue Recognition and Breakdown
But how is a company’s revenue recognized by an accountant? In most firms, once a product is sold it is recorded as revenue. For long-term services and products, the revenue per year is often subject to debate, and does not have a universal standard in a sense. One way that accounting standardizes this is the ASC-606 section of the Accounting Standards Codification, which states that an accountant should depict transfer of goods in an amount that the firm would expect to be entitled to. For example, a real estate developer’s revenue should be recognized as construction progress throughout the duration of the project. Another way to look at it is a software firm’s performance determining when revenue is recognized.
In cases of multi-national scale companies, revenue is broken down into geographical areas around the world. This way, companies, accountants, and investors can see which areas generate better performances for the company. Similar to geographical breakdown, some companies will break down revenue by company sector or business segment. This way third-parties can observe the way specific departments of a company perform against each other. Now, let’s break down each expense on the income sheet further.
Operating Expenses
As previously described, I defined operating expenses as the costs of performing business. In most cases, the main operating expenses are COGS (cost of goods sold). Some examples of COGS are the cost of raw materials, labor costs, and manufacturing costs. When all costs of goods sold are netted out from revenues, we are left with the gross profit of a company. SGA, closely related to COGS, has to do with general costs of the company. SGA includes salaries, wages, and benefits for executives and staff not directly involved in manufacturing, rent, utilities, and insurance payments. SGA is a very diverse category for company expenses, and can even be categorized for a broken sink in a company building. Though I mentioned SGA as a component of operating expenses earlier, there are minor technical differences that make SGA a special category of expenses known as non-operating expenses. When the non-operating expenses are netted out from gross profits, you get the operating income of a company.
Depreciation
Accountants also account for the devaluation of assets and the company during the period of evaluation, usually in the form of accounting, tax, and economic depreciation. Economic depreciation refers to an asset that loses value with age. For example, a car depreciates the longer it is owned (in most cases). Accounting depreciation refers to depreciation based on a schedule, where the rate of decline can be modeled by either a linear or exponential function. Tax depreciation reflects what tax will allow as depreciation to calculate taxable income.
Financial Expenses
As mentioned before, the most common financial expense a company will face is interest expense on debt. Some of these interest expenses are implicit, meaning they are calculated based on an assessment of debt equivalent to their commitments (contracts, etc.) and the current interest rates. Usually, interest expenses are netted against interest income and are reported as net interest expense to have one value reported instead of two. If the interest income exceeds interest expense, it will be noted as net interest income, and vice versa.
Income From Non-Operating Investments
The income sheet will also document income from investments unrelated to company operations. The main component of this is cash and marketable securities, or the income earned on holding like marketable securities or treasury bills. These incomes are noted as stand alone incomes or against interest. The secondary non-operating investment group is cross holdings in other companies. This takes the form of companies holding major shares, minor shares, or owning another company. A minority ownership of a company is included exclusively as income on the statement, while a majority holding of another company will be written as if the owning company is the full and complete owner, and therefore accounts for 100% of the subsidiary’s revenue, operating expenses, etc. within their own statement.
Extraordinary Income and Expenses
The final major category of income and expenses that will be on the income sheet is the extraordinary income and expenses section. These are not included in the usual course of operations, and are usually one-time expenses or a result of selling assets. They can also take the form of write-offs or charges from past projects, lawsuits, and fines. These income sources or expenses should be showing up infrequently to be considered a legitimate extraordinary income or expense.
Business Life Cycle

In this model, we can see how revenue and profit changes as a business develops, through several stages of life. Almost all successful companies follow this growth pattern, and we can see this through several examples of different income statements. By using this model and reading a company’s income statement, we can make a more informed analysis on what the future projections of a company’s revenue and profit entails. This chart is standard between different financial analysts, but generally remains undisputed throughout. We can start with an example of a younger company: Peloton.
Young Company: Peloton
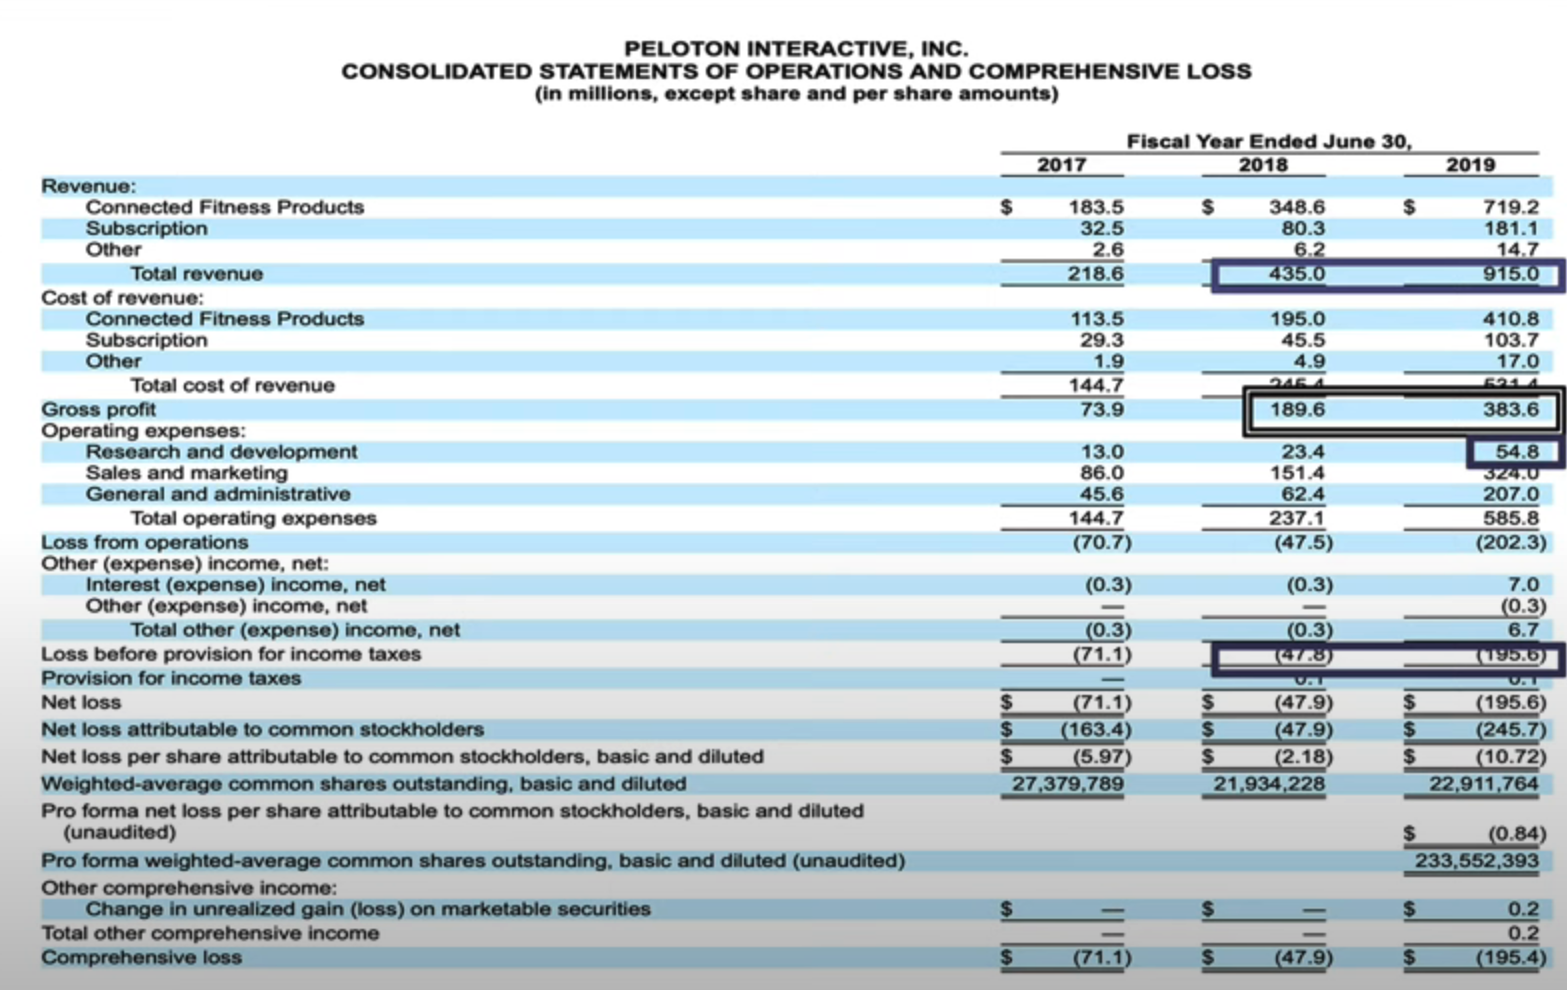
Here, we can see the publicly released income statement of Peloton, an American exercise company that offers asynchronous classes connected to high-tech exercise equipment, recording income metrics from the fiscal years of 2017, 2018, and 2019. Their business model aims to connect users from around the world to a unified platform for fitness through expensive cardio tools and equipment. Peloton was publicly released in 2019, making it a great candidate for the earlier stages of the business life cycle. But what exact metrics on the income sheet can point us towards the idea that a 2019 Peloton fits so well with the first two categories of the life cycle? We can start by looking at the change in total company revenue from 2017 to 2018, and 2018 to 2019. The revenue grew from $216.6 million to $435.0 million, roughly doubling, and from $435.0 million to $915.0 million. Looking at our chart, we see that both the start-up and young growth sections of the life cycle have high growth rate and growth in revenue, which fits with the change in revenue described by the income statement. We can also see that the gross profit grows healthily over the two year interval. Something especially characteristic about this statement is the loss in net income. This is fine for the company, because it is very uncommon for a start-up to profit in their first years, even if they will profit by large margins in the future.
Growth Company: Netflix
In 2020, a prevalent movie and video servicing company was on the rise: Netflix.
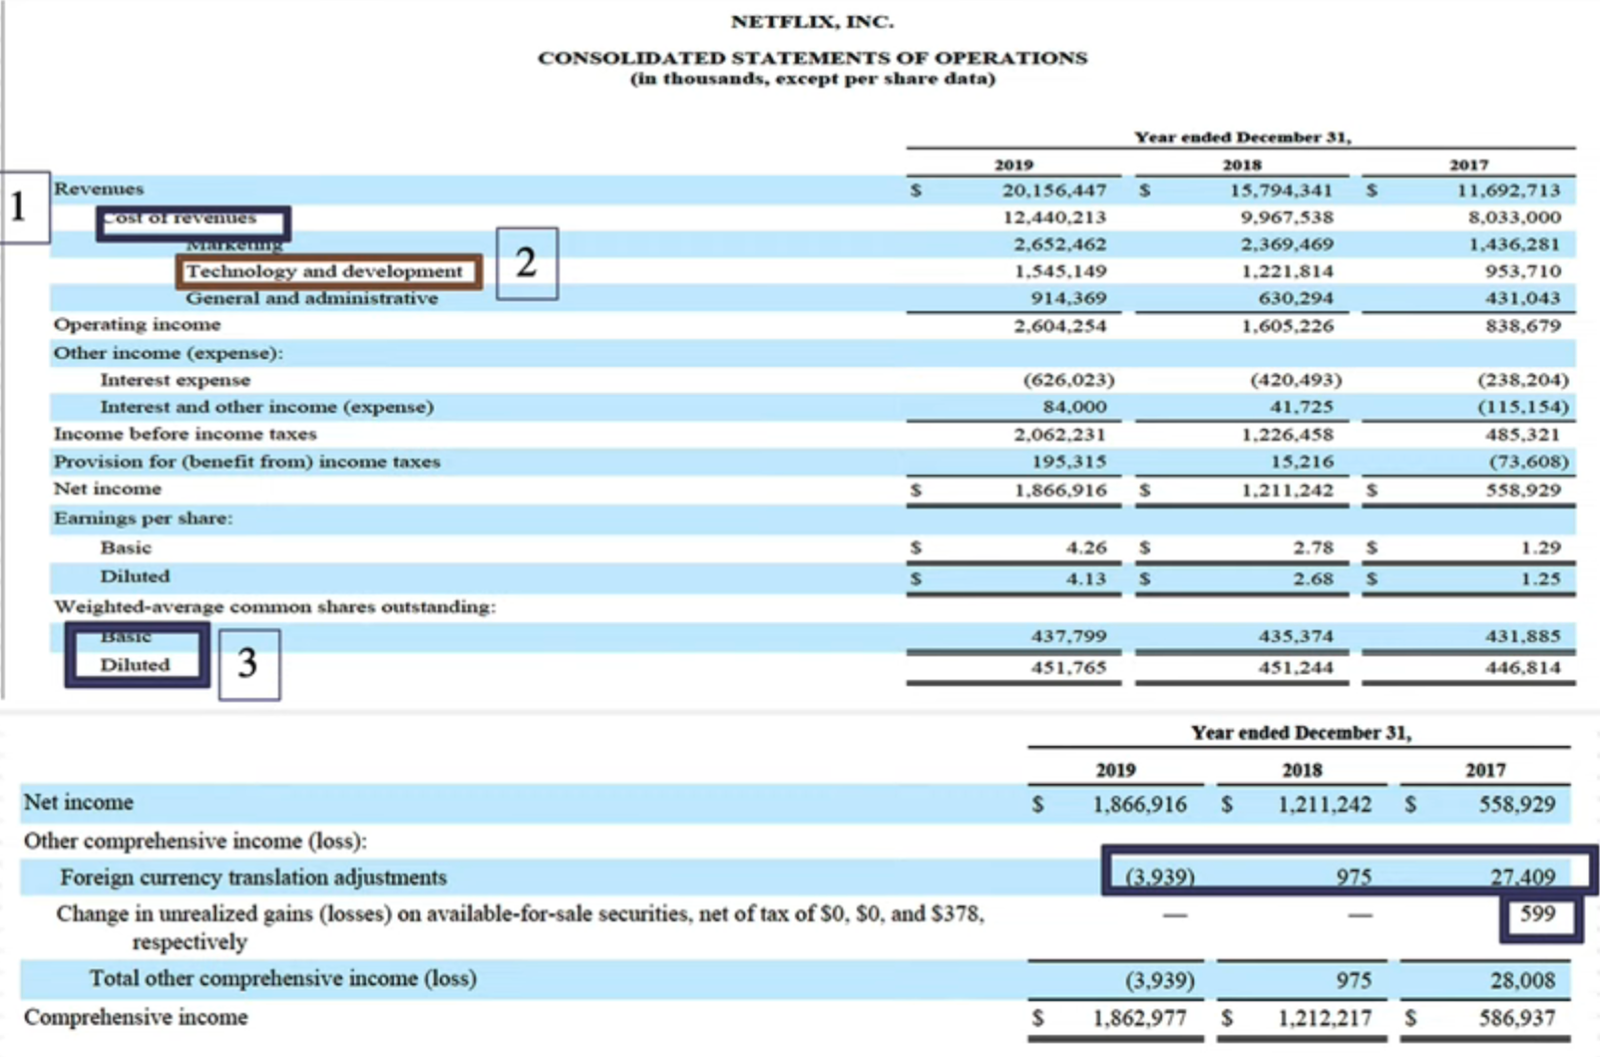
Netflix is a subscription based media providing service, which in 2020 was proving to enter the growth stages of the cycle. But how can we see this on the income statement and compare this statement to that of Peloton in the previous year? We can see that the company as a whole is growing through the revenue, but not as much as Peloton was. We can see that the largest cost of revenue is marketing, versus the same being the fitness products of Peloton. We do see that Netflix’s net income grows healthier than Peloton, and they are more profitable as a company. Something unique we can see about Netflix through this income statement is Netflix’s income loss from foreign adjustments, which makes sense as Netflix caters to different languages and parts of the world. But what makes this expense non-extraordinary? Because this expense is considered over three statements, it is considered a regular expense, and cannot be considered extraordinary.
Mature Company: Coca Cola
One of the largest soda manufacturers and snack-product sellers in the world, Coca Cola has formed an international hold on the snack industry. They have been successful for decades, and even offer a very high stock dividend as a result of their steady growth over many years. Even though they were once a flourishing, growing company, Coca Cola are no longer at the heights they once were. We can see from their 2019 income statement that their revenue growth is fairly low, as it barely changed from 2017 to 2019. We can see that their largest expense is selling, general, and administrative expenses, which are almost the same in price as cost of goods sold. But why is this so, and what does this tell us about Coca Cola as a company? Well, in our Peloton and Netflix examples, the cost of goods sold is much higher, as their products and services cost much more capital compared to Coca Cola. Coca Cola’s product is much cheaper to produce in high quantities, leaving them with a larger profit margin compared to Netflix and Peloton, which need much more to produce the same quantity of goods, per se. This is likely why Coca Cola lasted this long into the business life cycle, as their model requires less capital to continue sales and production. We can also see that Coca Cola was able to make a lot of money from their holdings, which further attributes to their decision to have a high dividend yield in their stock: further incentivising market holders to pour more into their stock. Coca Cola is a very good example of a company whose model and ideology was sound enough to last until the maturing stage.
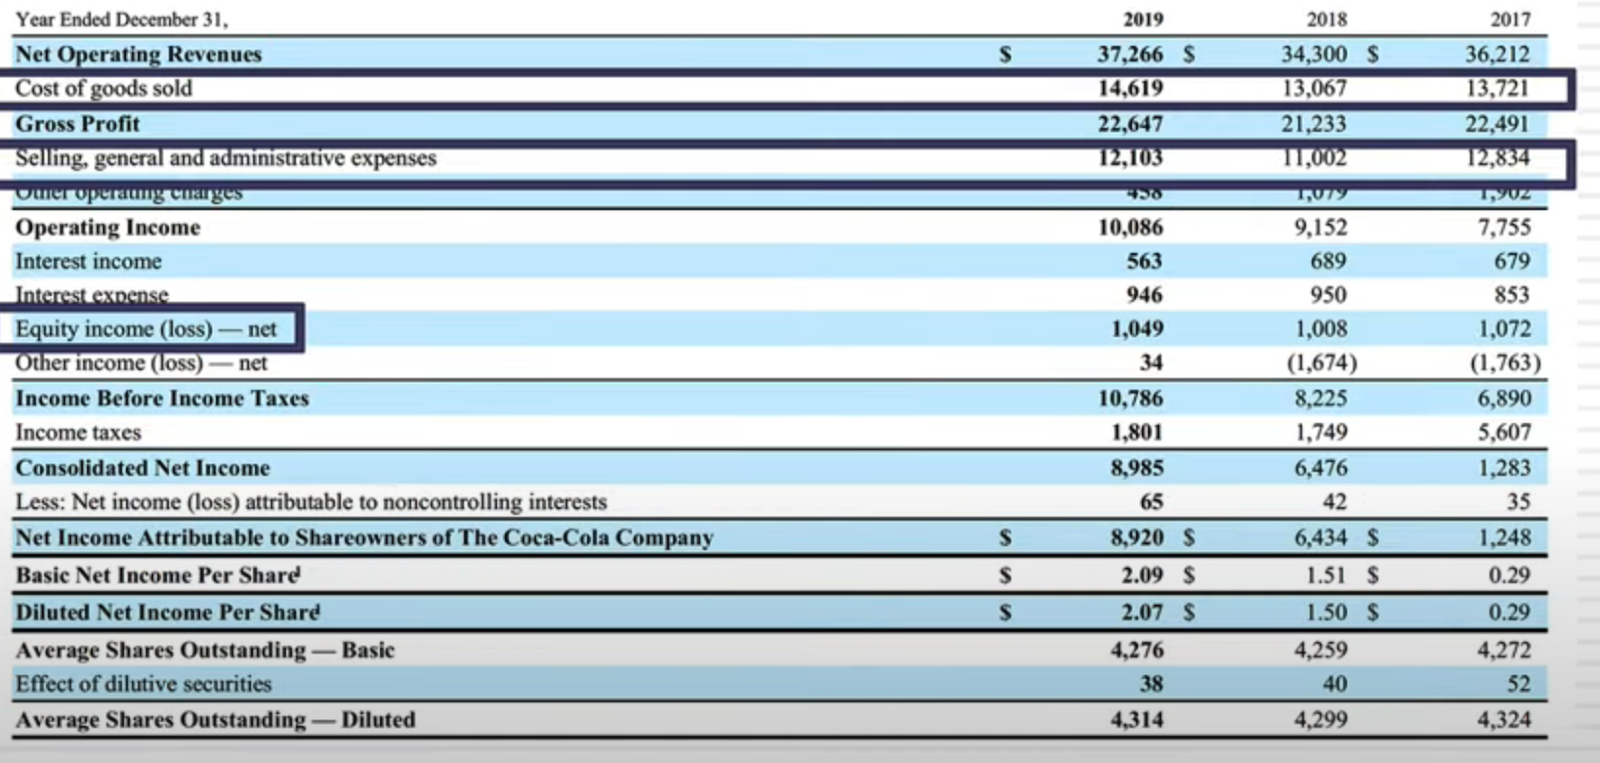
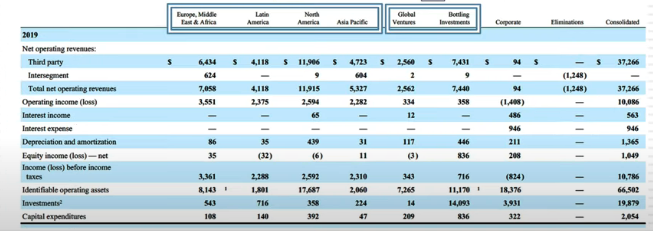
We also see companies such as Coca Cola break down their respective revenues and expenses by geographic region, to further explain where their respective successes and failures reside around the world. These regions are often grouped based on manufacturing facility locations as well as contiguous regions. This explains why Europe, Middle East, and Africa are grouped, and the Americas are split. We can also see how much Coca Cola brings in yearly from their other global ventures and investments with major banks along with international.
Aging Company: Toyota
Despite commercial success over the last decades, Japanese automotive company Toyota has entered a declining state. Their vehicle production, technology, and reliability was niche enough to reach the maturing stage, but they have failed to meet the requirements and standard that new automobile industry leaders (mainly the movements of Tesla) have set.
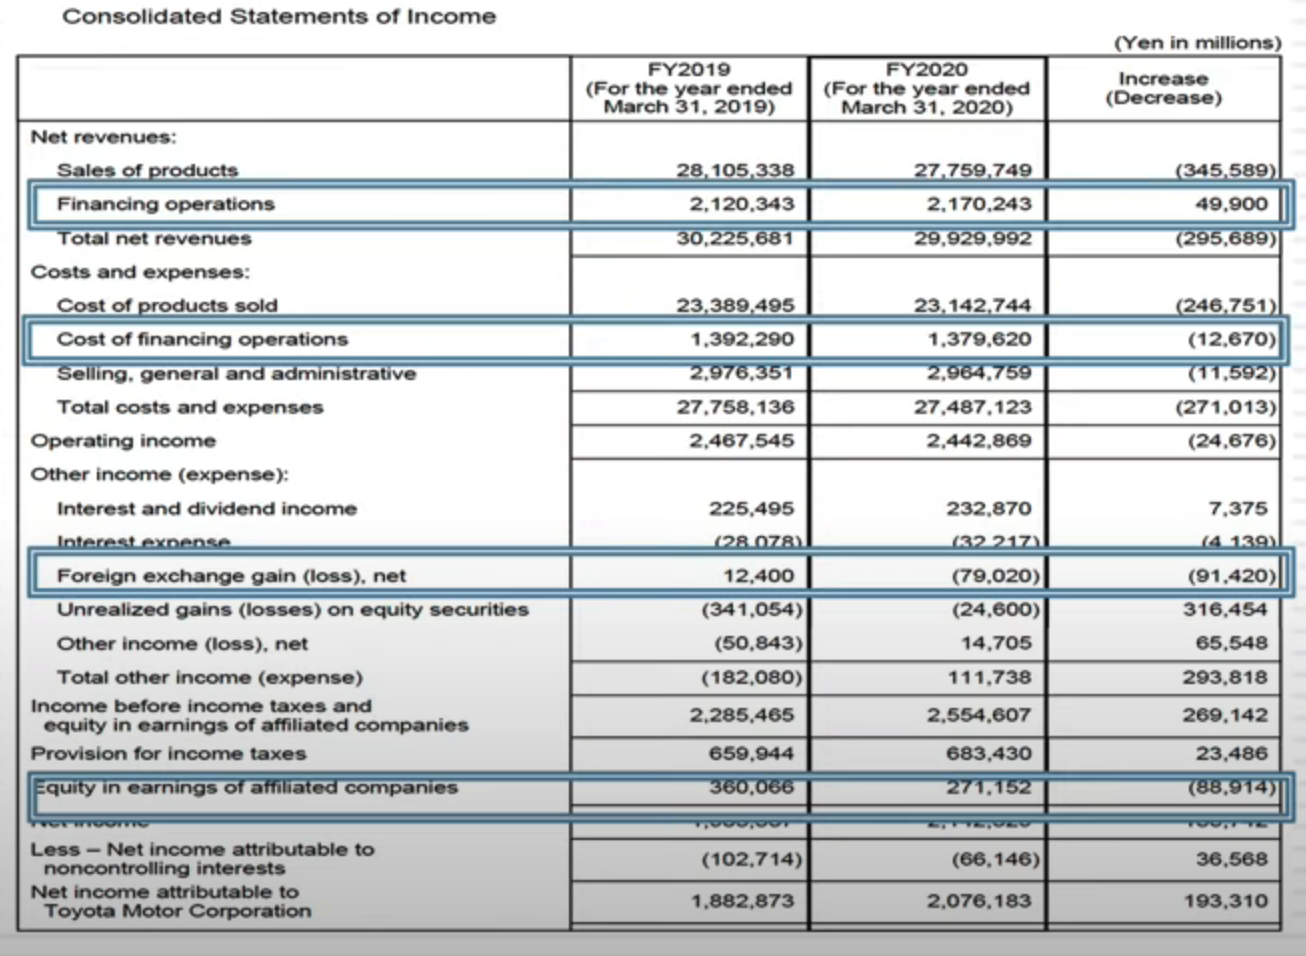
We can see from their 2023 income statement that their revenue in 2023 is in fact less than 2019, which is in fact a sign of a declining company. We also see a unique category called financing operations, which refers to the expenses Toyota faces running a banking system within their company. This is common in companies that don’t necessarily involve many financial transactions, such as automotive and medicine. Between 2019 and 2020, Toyota has a decrease in foreign exchange of 91 billion Yen, further emphasizing their unfavoredness in the international automobile scene. We can also see that the equity in earnings of affiliated companies (subsidiaries) declined as well. This report proves that Toyota has long past their peak as a company, and are soon to possibly fall out of leading their industry in the coming decades.
Sector and Industry Differences
As we know, accounting standards about revenue measurement and earnings remain the same across companies, but may consist of different metrics between sectors. For example, commodity based companies will have costs expanded for commodity reserves and extraction, whereas a financial service company will have challenges defining revenue and debt.
Total (French Oil Company):
Total is a French oil company, which showcases sector differences specific to oil and other commodity companies particularly well in their 2019 income statement.
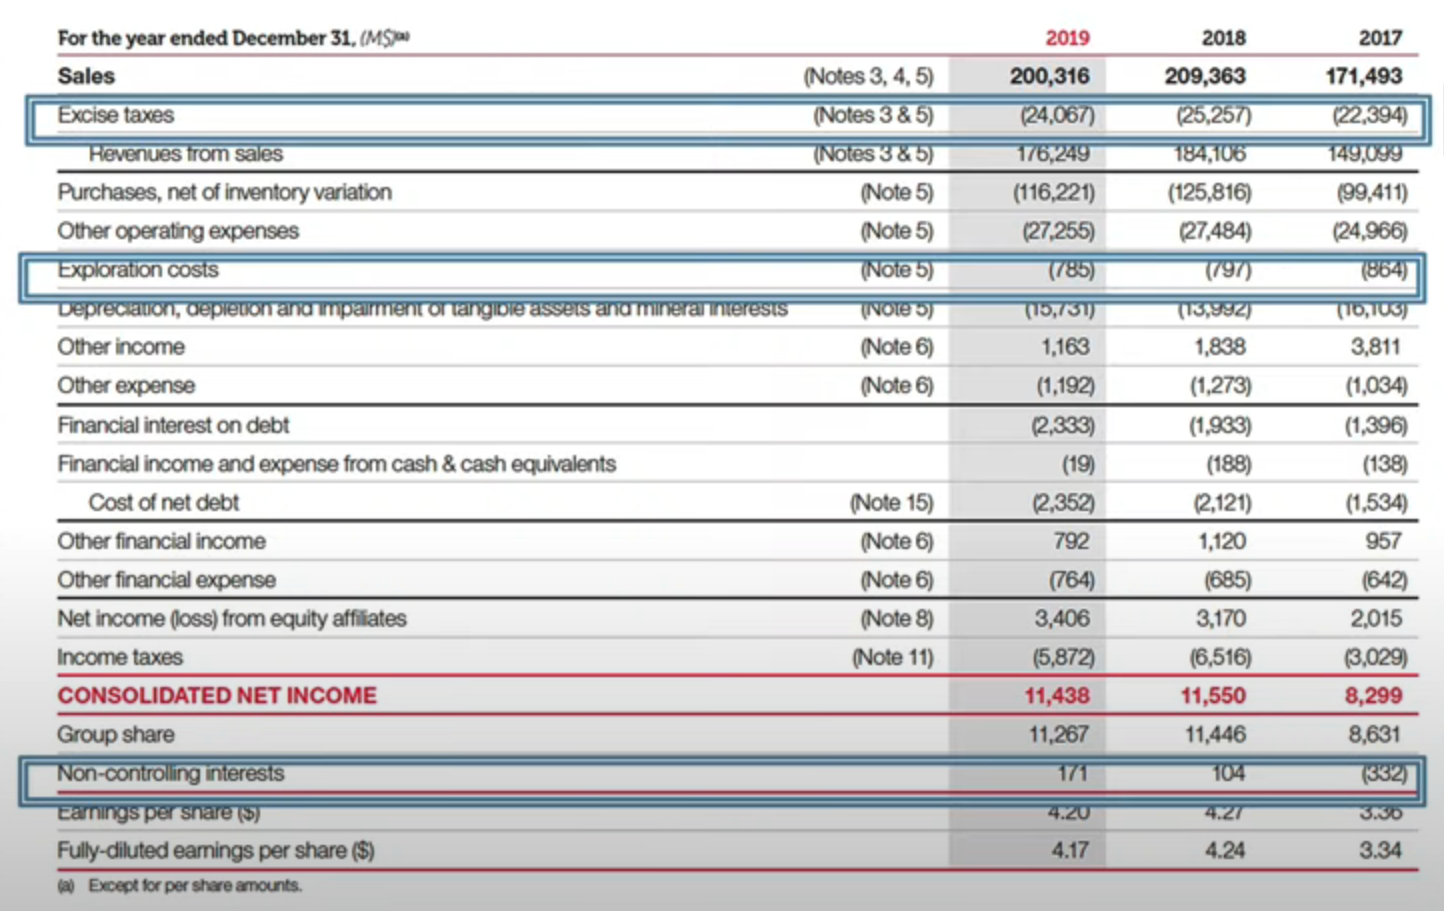
The beginning number that jumps out to us is excise taxes, which are a tax form administered by the government. These particular taxes are specific to oil companies in the sense that a medicinal company with similar performance will not face. Their exploration costs, which has to do with finding safe and usable oil reserves for extraction, are a high net loss for the company. We also see that their non-controlling interests (or their equities) grow positively. Total’s business breakdown is very specific to oil companies because of their categorization of sales, making sense solely for oil companies. The categories shown above that contribute to this are exploration, production, integrated gas, renewables, power, refining, chemicals, marketing, and corporate as a collective set are all incomes and expenses that would only be present together in an oil company’s statement.
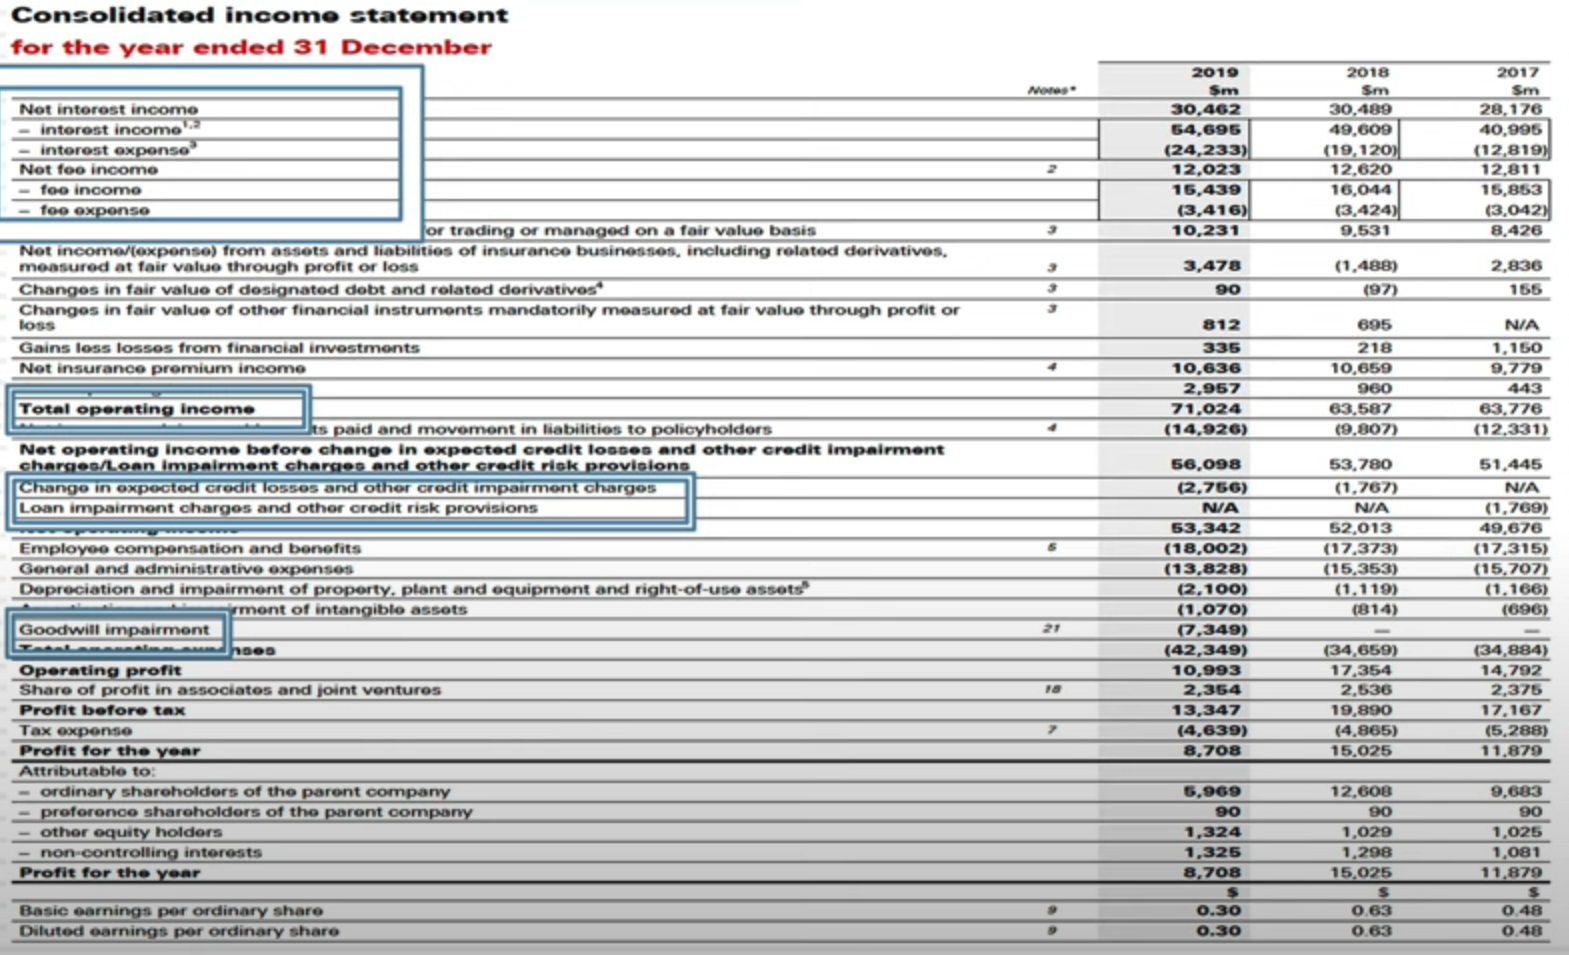
HBSC (Financial Service Company)
HBSC is a leading global bank based in Asia. A problem that companies like HBSC will face is documenting written revenues, as there isn’t a direct process for banks to measure that. Banks, like HBSC here, will start with documenting interest income and expenses, and then income and expenses from transaction fees. Something specific to banks like this is that operating income is calculated after interest because of the nature of banks as a business, as they also have a large focus on equity income as their main income. Credit losses, risk provisions, and other metrics specific from customer to customer are also specific to banks, being the only industry that needs to account for these numbers in their specific statements.
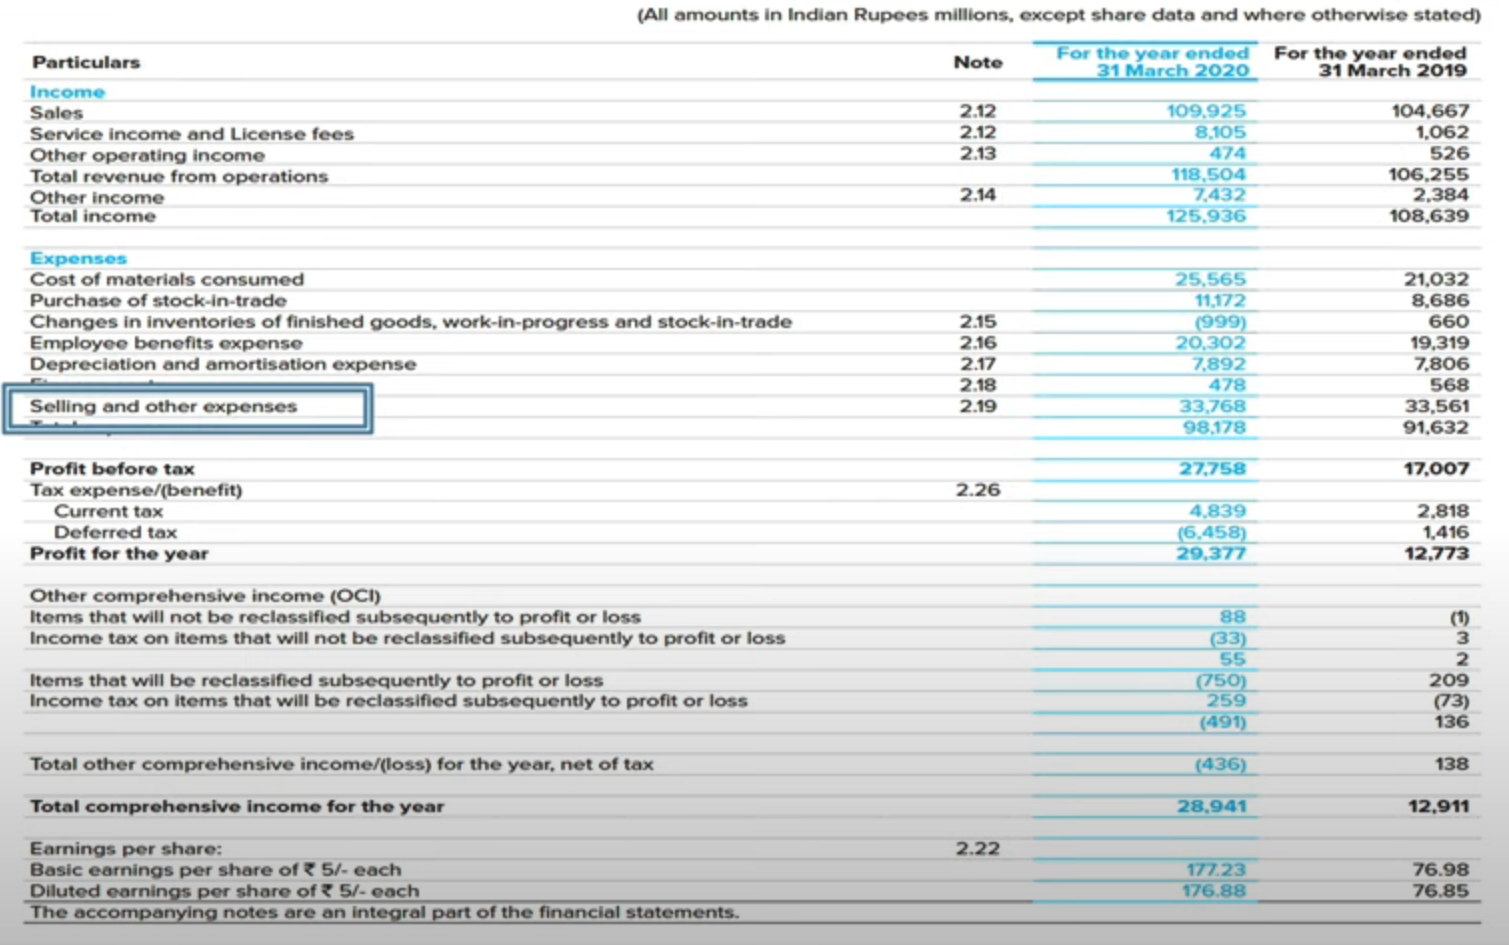
Dr. Reddy’s Pharmacy (Pharmaceutical)
A multinational Indian pharmaceutical company, Dr. Reddy’s Pharmacy also displays similar industry specific trends and metrics like Total and HBSC. Their selling and other expenses dominate the total operating expenses, and they have several items specific to pharma’s research and development related expenses.
Applying the Knowledge
Accounting standards are always covering, and never diverge, While revenue items and operating expense items are different between companies, the end goal in measuring profits stays constant between all industries and companies. Based on this understanding, anyone can compare the numbers of income statements across companies and sectors.


