
Doctors use indicators like heart rate and blood pressure are to measure well-being. Similarly, economists rely on a number of indicators to help them understand the health of the economy. There is a wide range of economic indicators. But, certain indicators like the rate of unemployment or the price level are often seen as some of the most important measures of economic health. Not only do these indicators provide us with important individual measurements of economic health, but equally as informative is the relationship shown between these indicators. One of these indicators is the Phillips curve. The Phillips curve depicts the inverse relationship between the levels of inflation and unemployment within an economy.
History
After a comprehensive study of many decades of data from the British economy, economist A.W. Phillips published a paper on his discovery of an inverse relationship between rates of unemployment and changes in inflation. The graph below is directly from the original publication of Phillips’ study and clearly depicts the negative correlation he observed.

A couple of years later, following independent studies that had reached similar conclusions, economists Paul Samuelson and Robert Solow officially established the inverse relationship that is known today as the Phillips curve. This economic advance led to the formal acknowledgment of the tradeoff between unemployment and the rates of inflation. This Phillips curve was initially thought to represent a stable and structural relationship. But, economists would later conclude that the model was not reflective of the long run behaviors of an economy. Therefore, the inverse relationship first depicted by Phillips is commonly regarded as the short run Phillips curve.
Short Run Phillips Curve
An important component of the relationship that the Phillips curve depicts is the concept of tradeoffs. We face tradeoffs all the time in our everyday lives. Whether deciding how to spend our time or what to eat for our next meal, we are constantly giving up one option in exchange for another. Economic trade-offs are very similar to those we face in our daily lives. The Phillips curve is the perfect example of this idea of tradeoffs.
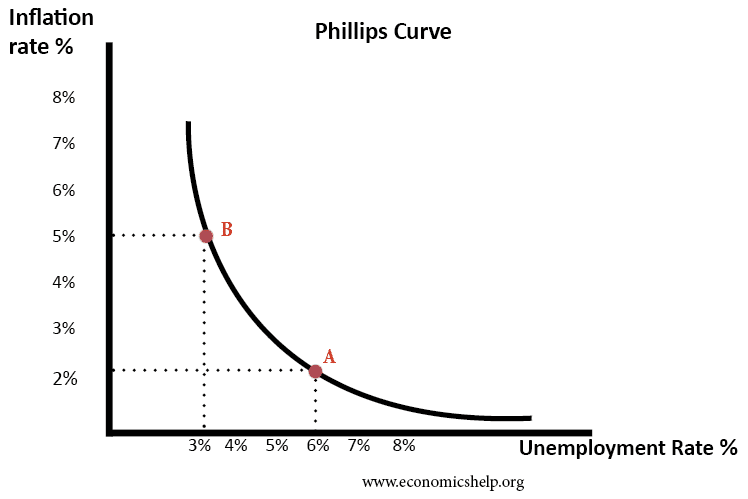
At any given point of the Phillips curve, the rate of unemployment within an economy is correlated with a certain rate of inflation. So if an economy is facing high rates of unemployment, policymakers might attempt to decrease rates of unemployment at the cost of increasing the rate of inflation. In contrast, an economy with high inflation rates might work to decrease the price level, at the risk of increasing the rate of unemployment.
Movements Along the Curve
Any given point on the Phillips curve shows the levels of unemployment and inflation within an economy and the trade-off between the two. So how does an economy actually move from point to another along the curve? The answer is through changes in aggregate demand. Aggregate demand represents the sum of all demand (by consumers, businesses, governments, and foreign nations) in an economy. When there is an increase in aggregate demand, the price level and output of an economy increases. This is shown by a leftward movement on the Phillips curve, as both inflation and production have increased. Increased production means lower levels of unemployment. Similarly, a decrease in aggregate demand will lower levels of inflation and decrease production, which increases unemployment. This causes a rightward movement along the Phillips curve.

Shifts of the Curve
Not only can changes in the state of the economy cause movements along the Phillips curve, but the Phillips curve itself can also shift. Shifts of the Phillips curve are caused by the result of changes in aggregate supply. Aggregate supply is the supply of all goods and services in an economy at a given price level. An increase in aggregate supply causes a decrease in the price level, but an increase in output. This is seen by a leftward shift of the Phillips curve, as each point of output is now correlated with a lower price level.
Similarly, a decrease in aggregate supply increases the rate of inflation at each amount of output, shifting the Phillips curve to the right. An easy way to remember this is that a shift of the aggregate supply curve will cause the Phillips curve to shift in the opposite direction.

Criticism
Many renowned economists initially welcomed the idea of the Phillips Curve. But, the relationship that the Phillips curve presented eventually proved unsustainable in accounting for long term economic trends. As many nations welcomed the idea of decreasing unemployment in exchange for higher levels of inflation, economists were beginning to notice varying levels of inflation at given levels of unemployment. In particular, America’s economic stagflation of the 1970s presented the Phillips curve with a new bout of scrutiny. Stagflation describes an economy facing both increasing levels of inflation and unemployment. By nature, this occurrence is a direct rejection of the relationship presented by the short run Phillips curve. The phenomenon was eventually explained by the adoption of the long run Phillips curve.
Long Run Phillips Curve
Monetarists like Ed Phelps and Milton Friedman spearheaded the rejection of the Phillips curve. They concluded that the negative relationship presented by the Phillips curve was only applicable in the short run. In the long run, however, it was determined that there was no such tradeoff between unemployment and inflation. The long run Phillips curve, instead, was established to be a vertical line, with the economy at the natural rate of unemployment for any level of inflation. The natural rate of unemployment is the rate at which the business cycle is at equilibrium, meaning no fluctuations up or down, and is equal to the sum of the frictional and structural unemployment rates.

Today’s Economy
Since its conception, the Phillips curve and the relationship that it presents seem to have undergone constant examination. In fact, in recent years, economists like Larry Summers have argued that the curve is flatlining and may be breaking down altogether. As for now, however, the consensus is that the curve holds. The relationship it presents can be very helpful in understanding the current state of the economy.


