Recently, the spread between the yields for 3-month and 10-year U.S. Treasuries has dropped below 0. Economists and investors across Wall Street have been spooked by this inversion, citing it as an indicator of the next recession in the US economy. But why is Wall Street claiming this indicator is a signal for the next economic collapse?
It helps to understand what the yield curve actually represents, and to do that, you need to know about bonds.
Bond Basics
Bonds are one of the most common investments in the world. There are various types of bonds, depending on who issues the bond. At its core, a bond is a loan. That means an investor gives money to an entity, and that entity pays back interest. There are four key aspects of a bond: yield, maturity, price, and face value. People like bonds because they are usually a low-risk investment. But, that also means that the potential reward is also lower than other investments, like stocks. The main risk on a bond is the risk of default. Default means that the borrower of the lender’s, or investor’s, money doesn’t pay the loan payments. That means that the investor doesn’t get a return on his investment.
The price of a bond is the amount someone would pay for the bond. The day the bond is issued, the price of the bond is called its face value, also called par value, and is usually $100 or $1,000. This means that entities, like governments and companies, sell their debt to investors in parts worth $100 or $1,000. After the bonds are issued, they are traded, and the bond price will fluctuate with demand for bonds. The yield on the bond is the interest on the bond, which is the additional payment for buying and holding the bond. On US Government bonds, widely considered as the safest bonds, the yield ranges from 2-3%. The yield on the day the bond issues is the coupon rate. The yield changes from there based on how the bond trades.
The key relationship to understand is that yield and price are inversely related: as one increases, the other decreases. This is because the bond pays a fixed amount every year, its interest (which is simple interest), in the face of any fluctuations in the bond. The maturity is the length of time the bond will pay interest for. For example, the US10Y is the US 10 Year Treasury and its maturity is 10 years.
On the day the bond matures, it will pay back its face value. That only will happen if an investor holds onto the bond until it matures. Let’s look at an example:
On the day a bond is issued, its face value is $100 and its coupon rate is 5%. It matures in 5 years. This means the annual amount is $100 x 5% = $5. So, after the bond is issued and starts getting traded, if the price falls from $100 to $80, then the yield on the bond can be approximated by $5/$80 = 6.25%.
If the demand for bonds is falling, then the prices of bonds fall, so the yields rise accordingly. Similarly, if the price of the bond rises from $100 to $120, then the yield on the bond would be $5/$125 = 4%. Since the bond will pay its interest for 5 years, and let’s assume you bought 1 bond for $100 dollars, you would get ($5 x 5 years) + (Principal) = $25 + $100 = $125 at the end of 5 years. Your net gain would be $125 – $100 = $25, or, essentially, the value of all of your payments.
If the bond’s price is less than the par/face value, then the bond is trading at a discount. If it’s more than the par/face value, then the bond is trading at a premium.
The Yield Curve
The yield curve deals with a specific type of bond: US Treasuries. US Treasuries are bonds sold by the US government and are considered to be the investment with the least risk involved. This is due to the widely held belief that the US Government is the most reliable borrower and that it will pay off all its debts. The government offers bonds with different maturities ranging from 1 month to 30 years. The important feature to note on these bonds is the yield and maturity, as there is a relationship between the two.
In any investment, a certain amount of risk involved. That holds true for investing in US government bonds, and even though the risk isn’t as high, there still always remains some level of risk. The longer the timeframe of the investment, the greater the risk is because more things have a chance of going wrong over a longer period of time. That relates to the idea of the time value of money, which is central to finance. Therefore, an investor takes less risk investing in a 3 month US Treasury as opposed to a 10 year US Treasury because the timeframe of the investment is shorter, and therefore, less risky.
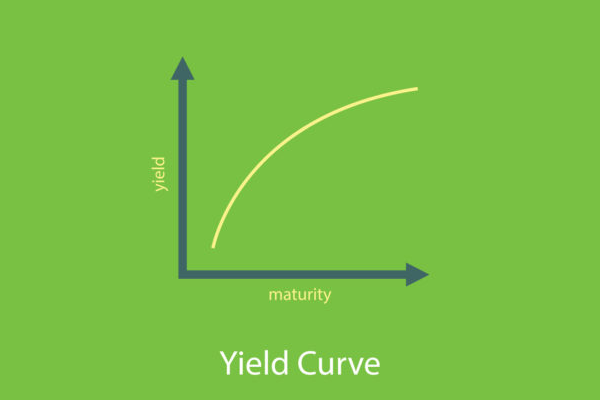
As you can see in the graph below, higher borrowing periods are associated with higher yields. This is because of something called Maturity Risk Premium. It exists because there is an increased risk of the bond losing value if the time it takes to mature is longer. In other words, when purchasing a bond for a longer amount of time, you incur more risk of your security decreasing in value. Hence, the increasing nature of the yield curve.
Since the 10 Year Treasury is more risky, to appeal to investors’ demand to have a higher return for the greater risk taken, the yield on the 10-year bond should be higher than the one on the 3-month bond. That’s the case most of the time. So, if we plot the yields of each bond with the yields on the y-axis and each bond’s maturity on the horizontal axis, as shown below, we get the yield curve.


A normal yield curve, like the one on November 26, 2018, is one where bonds yield more as their maturities increase.
Inversion
Typically, the Federal Reserve will lower interest rates when the economy is weak. This is because the Fed wants to stimulate the economy by making money cheaper to get. This cheaper money is in the form of loans from banks with lower interest rates.
But, if investors anticipate that the economy will weaken, they will want to lock in higher long-term yields on the longer maturity bonds before the Federal Reserve lowers interest rates, which lowers yields on those bonds. Again, the yields fall on those bonds because people want to buy them and will do so at higher prices. That increases the price of the bond and decreases the yield. The reason short-term bond yields increase is that investors believe that if a recession is on the horizon in the near future, then that will add more risk to their investments. Therefore, they will want a higher yield on the shorter-term bonds.
Further exploring this demand perspective, market participants increasingly want safer Treasury securities offering consistent returns during bear markets. With this higher demand, the price of bonds increases, and accordingly, their interest rates decrease. The demand for short-term debt securities and Treasury securities, however, is not as strong in recessions. Thus, the interest rates for those short-term securities will rise.
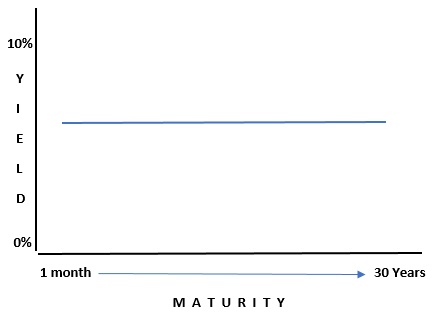
In other words, if investors think that the short-term is riskier, then they will want to be compensated more for short-term investments in bonds. That extra return demanded manifests itself in increased yields. When long-term bond yields fall below short-term bond yields, the yield curve flattens, as shown below.
After a yield curve flattens, it may proceed to invert. That means the yields on long-term bonds are lower than the yields on short-term bonds.
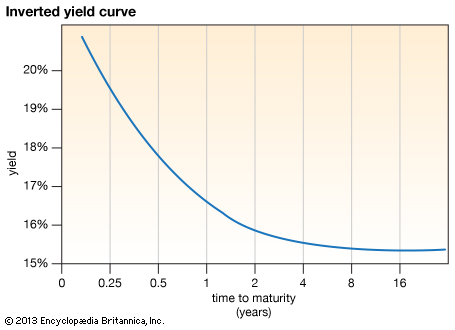
Typically, a full inversion won’t happen where the yields are always decreasing. Usually, there is a partial inversion, as shown below. As of March 27th, 2019, the 3-month to 10-year spread is -5 basis points (-0.05%). The spread is the difference between the yields of the 3-month to 10-year bonds. It’s calculated by subtracting the 3-month bond yield from the 10-year bond yield. If it’s negative, as it is now, then that indicates an inversion.

For the reasons mentioned above, the recent yield curve inversion has made investors cautious about the future. The heightened fear that a recession could arrive at the economy’s doorstep manifested itself with recent market drops.
Recession Fears Exaggerated?
Not everyone believes that the yield curve inversion means a recession. Mohamed El-Erian, the chief economic adviser at Allianz SE and former CEO of PIMCO, wrote in Bloomberg Opinion that this inversion doesn’t necessarily signal a recession in on the way. While every recession has been preceded by a yield curve inversion, not every yield curve inversion has preceded a recession. With only one exception, every yield curve inversion since 1962 has preceded a recession by a range of a few months to 2 years. Yield curves have preceded the last 7 recessions. El-Erian thinks that this yield curve inversion could be another exception. He cites consumption, a strong labor market, wage growth, and rising business investment as reasons for why a recession may not occur.
El-Erian also says that other bond markets, such as the corporate bond market, aren’t producing signals indicating an economic slowdown. He warns, however, that this inversion, if misread, could create a dangerous self-fulfilling prophecy. This means that the more people misread this inversion as a sign of a recession, the more likely it is that a recession could occur just because of the expectation that this inversion means a recession is near. More investments and spending decisions will be based on that belief, and therefore investors will want to take less risk. Less investment and spending would occur, deflating economic growth and possibly dumping the economy into a recession. Compared to the past yield curve inversions, the conditions for the most recent one differ considerably. Many investors and economists on Wall Street agree with El-Erian’s opinion, and time will tell if he’s right.
Looking Beyond
While the yield curve inversion is an important factor, it is important to understand that the yield curve is only one of many indicators. Recessions are far more complex than yield curve inversions. It is more important to understand the effects of the yield curve on consumers, investors, banks, and other parts of the economy. Economics and finance aren’t hard sciences, so it’s vital to understand that every number can mean multiple things. Their effects aren’t set in stone, and some of those effects have already been discussed in the article.
As with all occurrences in the economy, more context is needed to analyze and predict the future. If the curve inverts in a strong economy, then you can expect the curve to recover back to normal. But if conditions appear to be turning for the worse, an inverted yield curve can often confirm fears of bear markets in the future. As with all economic indicators, use the yield curve with a great understanding of underlying market conditions.