Valuation is the name of the game on Wall Street. If you think a stock’s true value is $50, and it’s currently priced at $75, you probably wouldn’t buy it. If you did, you would be paying 50% more than what it’s really worth. Warren Buffett famously stated that “Price is what you pay. Value is what you get.” But how do investors come up with the values they do for stocks? Before that question is answered, it is important to understand that every method of valuation is only an estimate. This is due to the valuation inputs being used being estimates and assumptions themselves.
One extremely common valuation technique is discounted cash flow (DCF). DCF involves predicting a company’s future cash flows, which refer to the total amount of cash being transferred into and out of the company, and discounting those cash flows to arrive at present values for those cash flows, the sum of which is the present value of the company, or its estimated intrinsic value, or true, real value. Discounting refers to using a discount rate to find the value of a future amount of money today. The discount rate is a rate of return representative of the compensation for bearing the risk of the investment.
If we assume a rate of growth for an investment, and we know what its future value is, we can use that rate of growth and work backward to see what amount must be invested today to end up with that future value later on, or its present value.
Discount Rate
There are several ways to determine the discount rate for the valuation of a stock.
Often times, people use the discount rate for a similar company or the industry the company is in. Investors still need a way to come up with discount rates, and there are two common ways to do that: CAPM and WACC. Let’s go over the two.
CAPM (Capital Asset Pricing Model)
Another common way is to use CAPM (Capital Asset Pricing Model), which uses the stock’s beta, or volatility compared to the market (S&P 500), the market’s return, and the risk-free rate, or rate of return of an investment containing virtually no risk, to determine the rate of return on the stock.
A stock’s beta is easy to find, as it can be found on the stock’s quote page on a variety of websites. For example, Amazon’s beta is 1.74, and Apple’s beta is 0.89, while the market’s beta, as measured by the S&P 500, is, by definition, 1. This means that Amazon’s stock price is 1.74 times as volatile, or variable, than the market’s, which means it varies more than the market, and that Apple’s stock price is 0.89 times as volatile, which means it varies less than the market.
The market return is also easily found, as it is usually the historical annual return rate of the S&P 500, which is about 9%. The risk-free rate can be found in many different ways but is commonly based on the US 10 Year Treasury, which is around 2%. Using CAPM, the appropriate rate of return on the investment in a stock can be determined easily, as you just need to plug in numbers into the CAPM formula:

“Ri” is the expected return on the investment. “Rf” is the risk-free rate. “Bi” is the beta of the stock, and “Rm” is the market return. Let’s take a look at two stocks and calculate their betas: Amazon and Apple. Amazon’s beta, as of May 31, 2019, is 1.74, so using 9% for “Rm” and 2% for “Rf,” plugging the numbers in the formula results in an expected return on Amazon is 14.18%. Doing the same for Apple, we get 8.23%. This means that our expected potential return is 14.18% from Amazon and 8.23% from Apple.

WACC (Weighted Average Cost of Capital)
Alternatively, you could use the WACC (Weighted Average Cost of Capital) model. Let’s break down what WACC is. Let’s start with the cost of capital. The cost of capital is the cost a company pays for getting financed. Another way to think about it is that it’s the required potential return needed for investors to consider funding that company. This model takes into account two costs that make up the cost of capital: cost of equity and cost of debt.
The cost of equity is the cost of getting equity financing, which refers basically to selling stock. The cost of debt is the cost of getting debt financing, which refers to bonds, loans, and other debt the company has received as financing from investors.
Basically, the cost of equity is the return that the company must offer to investors to get them to buy into their shares. That can be calculated using CAPM, which was mentioned earlier.
The cost of debt can be calculated by taking the weighted average interest rate needed to be paid on all debt the company owes. The formula for WACC may seem like a lot, but trust me, it’s quite simple. Conceptually, WACC is the cost of capital weighted by the proportion of financing coming from equity and debt and the returns promised on both types of financing. Here is the formula:

Let’s break this down. “E” is the market value of equity financing and is usually found by looking at the company’s stock market cap. “D” is the market value of debt financing and is usually the book value of debt. Book value is the theoretical value received if the company sold all of its assets and paid all of its liabilities. Book value, also known as the net worth, is found by subtracting the total liabilities from the total assets. “V” is the sum of “E” and “D” and represents the total amount of financing. Therefore, “E/V” is the percentage of total financing from equity and “D/V” is the percentage of total financing from debt. “Re” is the cost of equity and “Rd” is the cost of debt. “Tc” is the corporate tax rate, as taxes factor into the returns.

Here’s an example. Let’s say a company, XYZ Motors, has a market cap of $20 Billion and has issued $10 Billion worth of debt through bonds. The first $5 Billion of the issued bonds had an interest rate of 2%. and the remaining $5 Billion of the bonds were issued at 4%. The market value of equity is equal to the market cap: $20 Billion. The market value of debt is equal to $10 Billion of bonds. Therefore the combined market value of financing is the sum of the two: $30 Billion. The beta of XYZ is 0.9. Using 9% for the market return and 2% for the risk-free rate, we get an expected return of 8.3%. Therefore, the weighted cost of equity is ($20 Billion / $30 Billion) x (8.3%) = 5.53%.
The average interest rate on debt is ($5 Billion / $10 Billion) x (2%) + ($5 Billion / $10 Billion) x (4%) = 3%. The current corporate tax rate is 21%. So, the return on debt is multiplied by (1 – 21%) = 79%, which results in (3% x 79%) = 2.37%. Now we need to add our weighted costs of equity and debt, 5.53% and 2.37% respectively, to get our WACC. Adding them up results in 7.9%, which would be the discount rate used in a DCF analysis.
If a company has no debt financing, then the WACC formula yields the CAPM formula. This occurs because 100% of the financing is through equity. The cost of equity times 100% ends up as just the cost of equity, and CAPM can calculate that.
Discounting
Now that we have two ways to get a discount rate, let’s go through the math with an example.
Let’s say that ABC Technologies is a fictional technology company. It is an online marketplace and sells phones, computers, and tablets. It’s basically a combination of both Amazon and Apple. So, keeping it simple, we can say that its discount rate is the sum of Apple’s rate and Amazon’s rate. This is because it entails risks from both business models. That results in a discount rate of approximately 22%.
For simplicity’s sake, let’s predict only 5 years of cash flows for ABC Technologies. Here are the predicted cash flows: $100 Million for Year 1, $200 Million in for Year 2, $300 Million for Year 3, $400 Million for Year 4, and $500 Million for Year 5.
Now, we have to find the present value of each of those cash flows. The present value is what one must invest today to end up with a future amount, given a discount rate. Therefore, we need to divide each cash flow by the growth of the investment over time. So, for the 1st year’s cash flow, we need to divide $100M by (1+22%)^1 to find its present value. You could also multiply $100M by (1+22%)^-1, which results in the same operation and outcome. For the 2nd year’s cash flow, we need to divide $200M by (1+22%)^2 to find the present value. You repeat that for all the years you’ve projected, as shown below.
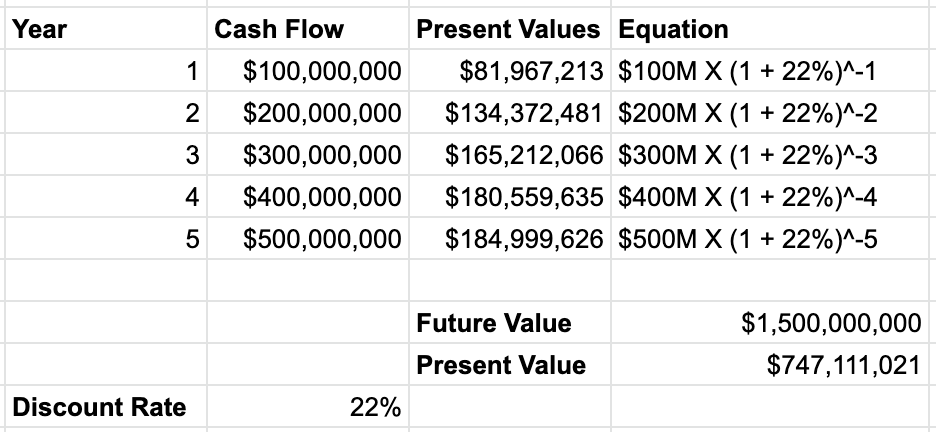
So, after finding the present values of each of the cash flows and summing them, we arrive at a present value of about $750M for ABC Technologies. This means that, based on your projections, the company’s intrinsic value, or real, true value, is about $750M today.
So, if ABC Technologies’ market cap was greater than $750M, then it would be considered overvalued. This is because it’s priced higher than its intrinsic value. If ABC Technologies’ market cap was less than $750M, then it would be considered undervalued. This is because it’s priced lower than its intrinsic value. Investors see undervaluation as an extremely strong signal to buy the stock because it’s essentially cheap. Undervalued stocks are what value investors, such as Warren Buffett, look for all day, every day.
What does the future value mean in this case? This means that if your predictions are true and the cash flows double each year and the discount rate remains the same, an initial investment of $747,111,021 would end up being $1.5B in 5 years. That essentially would mean your investment doubles in five years. Sounds great, right? Yes, but only if you’re right and the company brings in those cash flows. Because of the inherent risk involved, there is no guarantee an investment in stocks will return what you project it will. Additionally, every valuation technique is an estimate, as mentioned before. Therefore, an investment ABC Technologies, with its 22% discount rate and potential to double in 5 years, is most likely a risky one and may not generate the predicted cash flows.
Conclusion
Discounted cash flow is one of the most common methods investors use to value an asset that can generate cash flows. It involves an understanding of the asset’s future cash flows as well as the risk involved in it. That understanding of the future and the risk can be realized through equations such as CAPM and WACC. Discounted cash flow is only as accurate as its inputs, so it falls upon the investor to thoroughly research and understand the time, risk, cash flows, and the overall asset before running a discounted cash flow analysis and arrive at a valuation.